-
PRODUCTS & SERVICESOptimized cooling solutions for modern data centersProducts & ServicesOptimized cooling solutions for modern data centers
-
CAPABILITIESAdvancing liquid cooling technologiesCapabilitiesAdvancing liquid cooling technologies
-
TechnologiesLiquid Cooling InnovationTechnologiesLiquid Cooling Innovation
-
RESOURCESLatest News & InformationResourcesLatest News & Information
-
ABOUTOur history, leadership and ownershipAboutOur history, leadership and ownership
-
CONTACTFacility locations and global operational footprint






10 Tips for Choosing a Battery Storage System
Choosing a Battery Storage System requires more than comparing prices and advertised capacity. The right choice depends on daily energy use, solar production, backup needs, installation conditions, and future expansion. A system that looks impressive on paper may perform poorly in a shaded garage or during repeated winter outages.
Practical evaluation should examine usable capacity, round-trip efficiency, battery chemistry, operating temperature, warranty coverage, and safety controls. Small details matter. For example, a ten-kilowatt-hour battery may provide less usable energy after reserve limits and conversion losses. Monitoring software should also show clear data, including state of charge, power flow, alerts, and historical performance. These details help homeowners and businesses identify problems before a failed backup event.
Professional guidance remains valuable, especially when electrical loads, ventilation, or structural limitations complicate installation. Qualified installers can assess compatibility with inverters, solar panels, generators, and local grid requirements. Independent certifications and transparent warranty terms add confidence, but they do not remove the need for careful research. Capacity is not everything.
This guide presents ten practical tips for choosing a suitable system. It also considers degradation, maintenance, emergency access, installation costs, and long-term value. No checklist is perfect. Actual energy habits can change, and manufacturer estimates may differ from field performance. A thoughtful decision leaves room for uncertainty, verifies technical claims, and matches storage technology with real household or commercial needs.
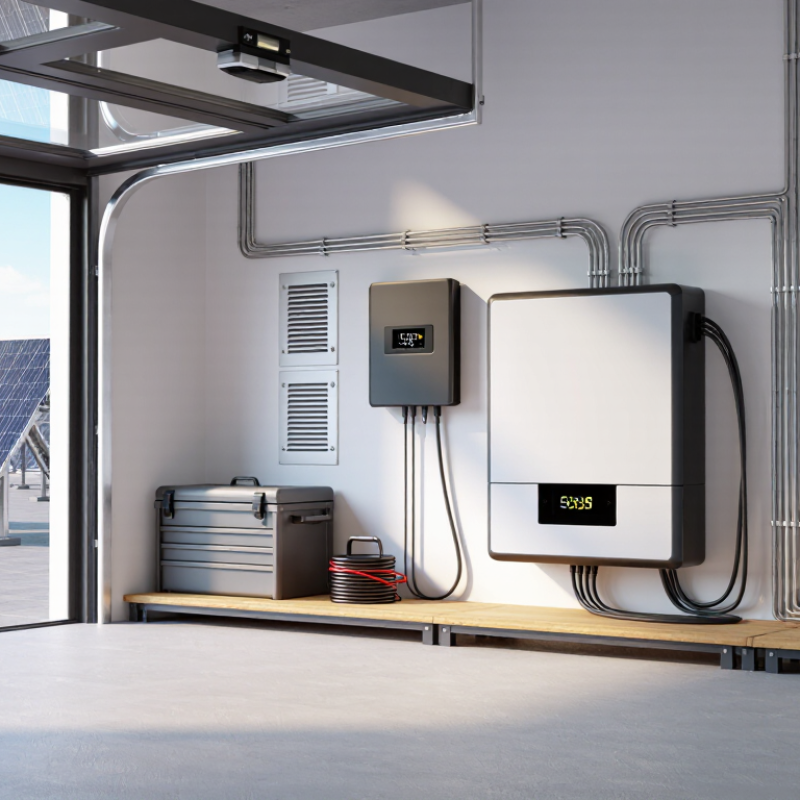
Table of Contents [Hide]
Define Load, Duration, and Peak Demand Before Sizing Storage
Define Load, Duration, and Peak Demand Before Sizing Storage
A battery system should begin with measured demand, not a guessed capacity. Record interval data in 5-minute or 15-minute blocks for at least one year. This reveals seasonal loads, overnight consumption, and short demand spikes. A home using 10 kWh daily may still need a 7 kW inverter for a brief motor start. Energy capacity and power capacity are different decisions.
Tip: Separate essential and flexible loads. Refrigeration, medical equipment, and communications may require backup. Water heating and vehicle charging can often shift outside peak periods. The International Energy Agency’s Batteries and Secure Energy Transitions report (2024) states that global energy storage capacity must increase sixfold by 2030. That growth makes disciplined sizing more important, not less. Oversizing wastes capital. Undersizing creates disappointing runtime.
Define duration with a real operating scenario. Ask whether the system must cover two hours, an overnight outage, or several cloudy days. Then account for usable capacity, round-trip efficiency, temperature, degradation, and reserve settings. NREL’s 2024 Annual Technology Baseline shows that battery costs vary substantially by configuration and duration. A longer-duration design is not simply a larger version of a short-duration system.
Tip: Test the calculation against the worst practical day. I once saw a load estimate exclude startup surges and winter heating; the spreadsheet looked precise, but the result was wrong. Recheck assumptions with measured data, an electrician, and the local interconnection requirements. Peak demand may deserve more attention than average consumption.