-
PRODUCTS & SERVICESOptimized cooling solutions for modern data centersProducts & ServicesOptimized cooling solutions for modern data centers
-
CAPABILITIESAdvancing liquid cooling technologiesCapabilitiesAdvancing liquid cooling technologies
-
TechnologiesLiquid Cooling InnovationTechnologiesLiquid Cooling Innovation
-
RESOURCESLatest News & InformationResourcesLatest News & Information
-
ABOUTOur history, leadership and ownershipAboutOur history, leadership and ownership
-
CONTACTFacility locations and global operational footprint


How to Choose Sustainable Data Center Cooling Systems
Choosing a cooling system is no longer a narrow engineering decision. It affects energy use, water consumption, equipment reliability, and operating costs. This is why Sustainable Data Center Cooling must be evaluated as a complete lifecycle strategy, not a fashionable technology purchase.
IBM thermal engineer Roger Schmidt has often emphasized, “The best way to cool a data center is not to cool it.” The idea is practical. Reduce heat at the source, improve airflow, and avoid cooling spaces unnecessarily. Hot-aisle containment, variable-speed fans, outside-air economization, and direct-to-chip liquid cooling can support this goal. However, each option depends on server density, local climate, water availability, maintenance skills, and future expansion plans.
Details matter. A poorly sealed cabinet can leak cold air beneath a raised floor. A cooling tower may perform efficiently while consuming significant water during a dry summer. Liquid cooling can support high-density artificial intelligence racks, yet it requires careful planning for pumps, hoses, leak detection, and technician training. There is no universal answer.
The strongest selection process begins with measured operating data. Review temperature maps, power demand, humidity patterns, and seasonal performance. Compare PUE and WUE, but do not treat either metric as perfect. They can hide local trade-offs. A lower energy score may still increase water stress or complicate repairs.
Some assumptions will fail.
That is normal.
A resilient design tests alternatives before construction. It also leaves room for monitoring, retrofits, and honest review. Sustainable cooling is not a single product. It is a disciplined balance between efficiency, reliability, environmental responsibility, and the realities of daily operation.
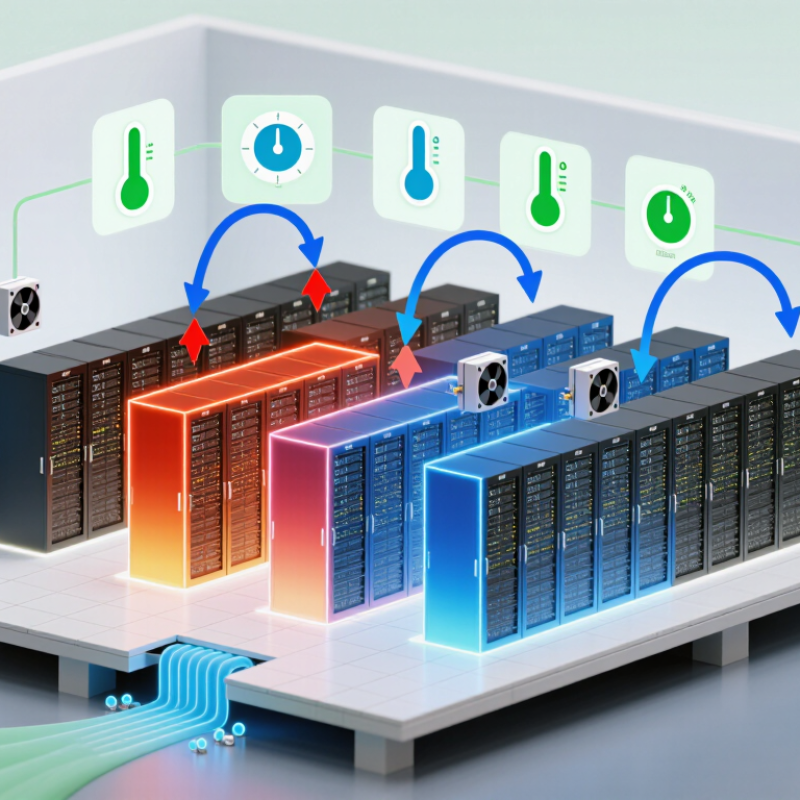
Table of Contents
[Hide]
Define Cooling Demand: Cooling Can Account for Up to 40% of Data Center Energy
Cooling can consume up to 40% of a data center’s electricity, according to the U.S. Department of Energy. That figure makes cooling demand a design priority, not an engineering afterthought. Start with measured heat output, rack density, workload patterns, and seasonal conditions. A 30 kW rack behaves very differently from a 5 kW rack.
The Uptime Institute’s 2024 Global Data Center Survey reported an average power usage effectiveness (PUE) of 1.56. The result shows that non-IT energy remains significant. However, PUE alone cannot explain cooling performance. Record supply temperature, return temperature, airflow, humidity, and cooling-water use. ASHRAE guidance places many conventional server environments within an 18–27°C inlet temperature range. Small sensor errors can still distort decisions.
Air cooling may suit moderate loads, especially when outside-air economization is available. High-density racks may require liquid-assisted systems, but the choice depends on workload growth and maintenance skills. Water availability also matters. A system can reduce electricity while increasing local water stress. That trade-off deserves uncomfortable attention.
Do not size equipment from average utilization alone. Peak computing events can create sharp thermal spikes. Build a demand profile from real operating data, then test failure scenarios and partial-load efficiency. A neat spreadsheet can mislead. Cooling demand changes as processors, layouts, and software change. Recheck the model regularly.
How to Choose Sustainable Data Center Cooling Systems - Define Cooling Demand: Cooling Can Account for Up to 40% of Data Center Energy
| Cooling System or Planning Dimension | Typical Operating Range or Share | Primary Energy and Water Characteristics | Sustainability Advantages | Key Limitations and Risks | Best-Fit Use Case | Selection Checks |
|---|---|---|---|---|---|---|
| Cooling Demand Definition | Cooling may account for up to 40% of total data center electricity use, depending on facility design, climate, utilization, and efficiency. | Peak cooling demand is closely related to IT power, while annual demand depends on operating hours, weather, humidity, redundancy, and part-load performance. | Accurate demand modeling prevents oversized equipment, unnecessary fan and pump energy, and inefficient low-load operation. | Using only nameplate IT capacity can overstate or understate actual demand. Future growth and equipment replacement must also be considered. | All new facilities, expansions, and major cooling upgrades. | Model peak, average, and annual loads separately; include future IT growth and a realistic diversity factor. |
| Air-Cooled Chiller System | Typical full-load chiller COP: approximately 2.5–4.5; actual seasonal efficiency varies by climate and part load. | Uses outdoor air for heat rejection and generally avoids cooling-tower water consumption. Fan energy can increase in hot weather. | Lower water dependence, simpler water treatment, and easier deployment where water availability is limited. | Usually less efficient than water-cooled systems during hot conditions; outdoor temperature directly affects performance. | Small to medium facilities, dry climates, and sites with water constraints. | Check seasonal efficiency, condenser-fan control, sound limits, ambient-temperature derating, and redundancy. |
| Water-Cooled Chiller System | Typical full-load chiller COP: approximately 4.5–7.0; plant efficiency depends on chillers, pumps, cooling towers, and controls. | Often provides lower electricity use at high loads, but consumes water through evaporation, blowdown, and treatment processes. | High efficiency for large, continuously loaded facilities; strong performance when optimized at part load. | Requires cooling towers, water treatment, makeup water, blowdown management, and protection against Legionella risks. | Large facilities with stable high loads and reliable water supplies. | Evaluate total plant kW per refrigeration ton, annual water use, water stress, treatment requirements, and operating resilience. |
| Air-Side Economizer | Can reduce mechanical cooling hours when outdoor temperature and humidity are within the allowable operating envelope. | Uses filtered outdoor air to remove heat, reducing compressor energy. Fan energy, filtration, and humidity control remain important. | Can substantially lower annual cooling electricity in suitable climates and seasons. | Outdoor pollutants, smoke, humidity, and extreme temperatures may restrict operation or increase maintenance. | Facilities in cool or temperate climates with appropriate air-quality conditions. | Check ASHRAE-compliant temperature and humidity limits, filtration level, damper controls, and local air quality. |
| Water-Side Economizer | Can provide partial or full “free cooling” when outdoor conditions allow chilled-water production without compressor operation. | Reduces compressor electricity while continuing to use pumps, heat exchangers, and often cooling towers. | Lower mechanical cooling energy with fewer compressor operating hours and reduced refrigerant-related impacts. | More complex piping and controls; water use may remain significant when cooling towers are used. | Large chilled-water systems in cool or seasonal climates. | Assess hours of available economizer operation, approach temperatures, heat-exchanger fouling, and control sequences. |
| Direct-to-Chip Liquid Cooling | Can remove a large share of high-density processor heat directly at the source; facility suitability depends on rack density and server design. | Reduces or eliminates much of the air movement needed for high-density racks. Heat rejection may still require a dry cooler, chiller, or cooling tower. | Supports higher rack densities, lowers fan energy, and can enable warmer water temperatures that improve heat-rejection efficiency. | Requires compatible servers, leak detection, fluid-quality management, and operational procedures for maintenance. | Artificial intelligence, high-performance computing, and other high-density workloads. | Define supply and return temperatures, rack density, water quality, leak protection, serviceability, and retrofit compatibility. |
| Rear-Door Heat Exchanger | Transfers heat from server exhaust air to a liquid-cooled coil at the rack boundary. | Reduces room-level heat mixing and may reduce computer-room air-handler fan demand. Water or coolant distribution is required at the rack. | Useful for targeted high-density cooling without converting every server to direct liquid cooling. | Adds rack weight, plumbing, maintenance requirements, and potential water-leak exposure. | Mixed-density environments with selected high-density racks. | Check rack loading, aisle containment, coil capacity, condensate risk, leak detection, and access for maintenance. |
| Hot-Aisle or Cold-Aisle Containment | Improves separation of supply and return air; energy savings vary with layout, control quality, and existing airflow management. | Can allow higher supply-air temperatures and reduce bypass air, fan speed, and unnecessary cooling capacity. | Relatively low-cost efficiency measure that can improve the performance of existing air-based systems. | Poorly sealed openings, cable penetrations, or mixed rack layouts can reduce benefits and create localized hot spots. | Air-cooled facilities with raised floors or perimeter cooling units. | Measure rack inlet temperatures, seal openings, balance airflow, and coordinate containment with fire-safety requirements. |
| Cooling Water Strategy | Water use varies widely with climate, cooling-tower cycles of concentration, load, and system design. | Water consumption includes evaporation, blowdown, makeup water, and treatment-related losses. Water use effectiveness is commonly expressed as liters per kWh of IT energy. | Higher cycles of concentration, dry cooling, reclaimed water, and optimized controls can reduce potable-water dependence. | Water-saving strategies may increase energy use, treatment complexity, or corrosion and scaling risks if poorly managed. | Any facility located in a water-stressed region or using evaporative heat rejection. | Track annual water use, seasonal water stress, source quality, discharge limits, and the energy trade-off of water reduction. |
| Performance Verification | Recommended indicators include PUE, cooling-system kW per refrigeration ton, WUE, supply-air temperature, and rack inlet temperature. | Continuous metering should distinguish IT load, cooling electricity, pump and fan energy, and water consumption. | Measured data supports corrective maintenance, accurate capacity planning, and continuous commissioning. | Incomplete submetering can hide inefficient equipment, incorrect control sequences, and seasonal performance losses. | All operational facilities and newly commissioned systems. | Set monthly and seasonal targets; verify sensors, alarms, set points, redundancy modes, and actual performance under partial load. |
Related Posts
-
Top 10 Supercomputer Cooling Solutions for Global Buyers
-
2026 Best Server Cooling Solutions for Global Buyers
-
China Top 10 High Performance Computing Cooling Suppliers
-
How to Choose AI Infrastructure Cooling Solutions?
-
China Top 10 High Performance Computing Cooling Suppliers
-
Top High Performance Computing Cooling Solutions?